ROS and ROS bags - Part3
Summary
Today I continued with extracting data from the rosbag files. I made improvements on extracting the images, and also worked on extracting the lidar point clouds.
Color images
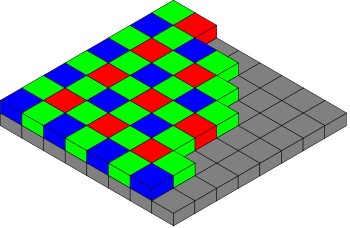
In yesterdays blog i extracted the images, but the images didnt seem to contain any color data. Actually it turns out I was wrong. The images do contain color data, except that it is not stored in separate channels. The images are encoded in a bayer color format which encodes different colors in adjacent pixel positions, in a grid like pattern as shown in the following image (courtesy of user Cburnett on wikipedia)

This can be converted to an RGB image using openCV.
from PIL import Image
import cv2
img = np.fromstring(msg.data, np.uint8)
img = img.reshape(msg.height, msg.width)
img = cv2.cvtColor(img, cv2.COLOR_BayerGR2BGR)
Image.fromarray(img).show()

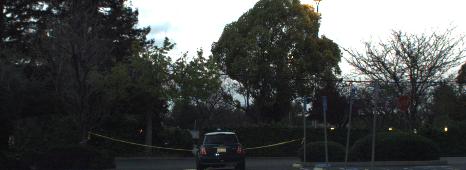
A video of all the frames from one bag extracted in this way is below.
Updated Code for Processing all Images in Bag
Now its time to update the code for processing all the images from a rosbag so that color is encoded in RGB.
import numpy as np
import cv2
import rosbag
bag = rosbag.Bag(bag_file, "r")
messages = bag.read_messages(topics=["/image_raw"])
num_images = bag.get_message_count(topic_filters=["/image_raw"])

for i in range(num_images):
    # READ NEXT MESSAGE IN BAG
    topic, msg, t  = messages.next()

    # CONVERT MESSAGE TO A NUMPY ARRAY
    img = np.fromstring(msg.data, dtype=np.uint8)
    img = img.reshape(msg.height, msg.width)

    # CONVERT TO RGB
    img = cv2.cvtColor(img, cv2.COLOR_BayerGR2BGR)

    # DO SOME PROCESSING ON THE IMAGE
    # ...
Lidar Point Clouds
I tried a similar apporach for extracting the lidar data, by using:
lidar = np.fromstring(msg.data, dtype=np.float32)
lidar = lidar.reshape(-1,4)
Which seemed ok, but there were some strange things about the values, the ranges of values just didnt quite seem right, and when i tried to visualize the data using mayavi, I didnt get anything recognizable in the scene. So i decided to have a search on google to find something that might be useful.
I stumbled accross this forum post which gave me some insights on how to better handle the lidar data.
This lead me to try the following code:
import sensor_msgs.point_cloud2 as pc2
a = pc2.read_points(msg)
Which resultied in a python generator object. When probing the next() method,
I got a tuple of values, which looked like they might represent point
coordinates.
>>> a.next()
(-2.0919997692108154, 8.933314323425293, -1.5073966979980469, 1.0, 16)
So I tried it again, this time converting the generator of tuples into a numpy array.
import sensor_msgs.point_cloud2 as pc2
lidar = pc2.read_points(msg)
lidar = np.array(list(lidar))
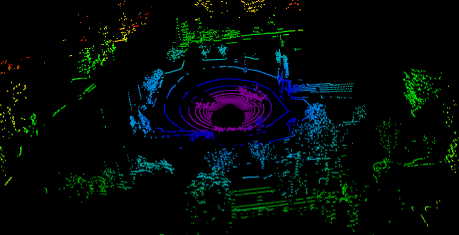
And then visualising it in mayavi using the following code:
# PLOT USING MAYAVI
import mayavi.mlab
fig = mayavi.mlab.figure(bgcolor=(0, 0, 0), size=(500, 300))

mayavi.mlab.points3d(lidar[:,0], lidar[:,1], lidar[:,2],
                     lidar[:,0]**2 + lidar[:,1]**2, # distance values for color
                     mode="point",
                     colormap='spectral',
                     figure=fig,
                     )
mayavi.mlab.show()

Template Code for Processing All Lidar Data in a Bag
import sensor_msgs.point_cloud2 as pc2
import numpy as np
import rosbag
import os

# ROSBAG SETTINGS
data_dir = "/path/to/data"
bag_name = 'approach_1.bag'
bag_file = os.path.join(data_dir, bag_name)

# OPEN ROSBAG
bag = rosbag.Bag(bag_file, "r")
messages = bag.read_messages(topics=["/velodyne_points"])
n_lidar = bag.get_message_count(topic_filters=["/velodyne_points"])

for i in range(n_lidar):
    # READ NEXT MESSAGE IN BAG
    topic, msg, t = messages.next()

    # CONVERT MESSAGE TO A NUMPY ARRAY OF POINT CLOUDS
    # creates a Nx5 array: [x, y, z, reflectance, ring]
    lidar = pc2.read_points(msg)
    lidar = np.array(list(lidar))

    # PROCESS THE POINT CLOUDS
    # ...
Importance of Synchronisation
One thing to note, is that there is not a 1:1 correspondence between readings from the different sensors. As can be seen from the following code snippet, there are approximately 3 times as many camera readings as there are Lidar readings over the same period of time.
bag = rosbag.Bag(bag_file, "r")
messages = bag.read_messages(topics=["/image_raw", "/velodyne_points"])
n_images = bag.get_message_count(topic_filters=["/image_raw"])
n_lidar = bag.get_message_count(topic_filters=["/velodyne_points"])

print(n_images)
# 333
print(n_lidar)
# 110
So if we intend to make use of multiple sensors together, we will need to match the readings up. Using the timestamp might be useful.
Comments
Note you can comment without any login by:
- Typing your comment
- Selecting "sign up with Disqus"
- Then checking "I'd rather post as a guest"