Calculating the derivative of Tanh - step by step
Summary
I recently created a blog post outlining how to calculate the gradients for the sigmoid activation function step by step. In this post, I will do the same for the tanh function.
The Tanh Function
The tanh function is just another possible functions that can be used as a nonlinear activation function between layers of a neural network. It actually shares a few things in common with the sigmoid activation function. They both look very similar. But while a sigmoid function will map input values to be between 0 and 1, Tanh will map values to be between -1 and 1.
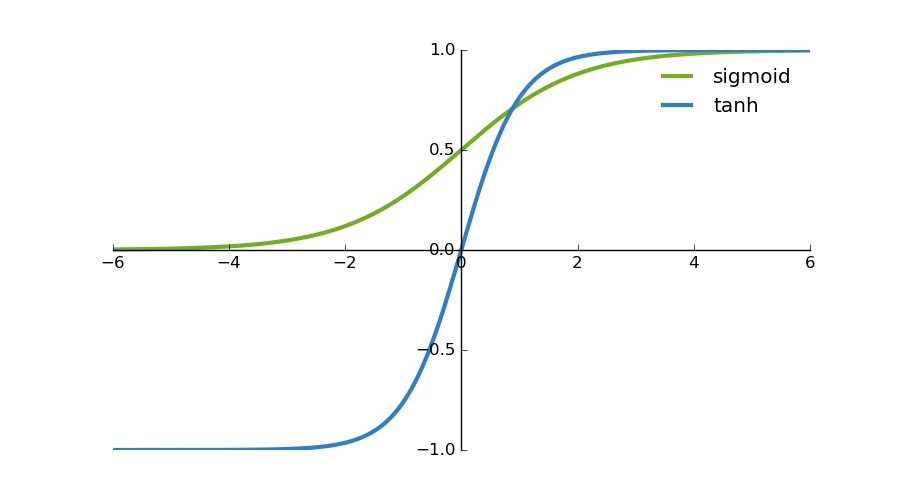
You will also notice that the tanh is a lot steeper.
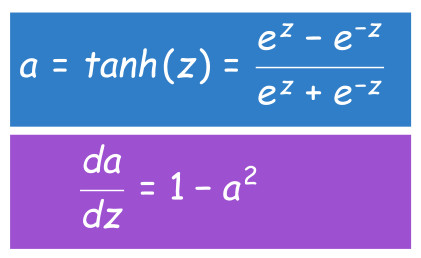
Like the sigmoid function, one of the interesting properties of the tanh function is that the derivative can be expressed in terms of the function itself. Below is the actual formula for the tanh function along with the formula for calculating its derivative.
Calculating the derivative
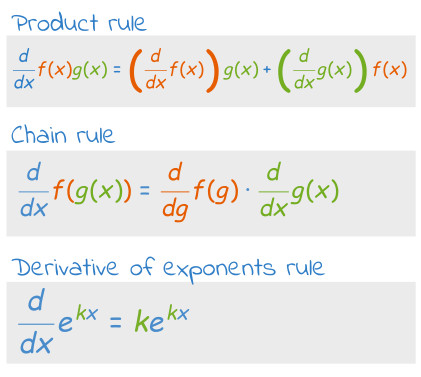
Below, I will go step by step on how the derivative was calculated. But before we start, here are three useful rules from calculus we will use.
We can start by representing the tanh function in the following way.
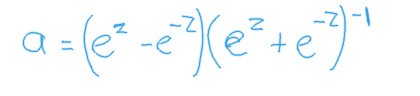
When represented in this way, we can make use of the product rule, and carry on as follows.
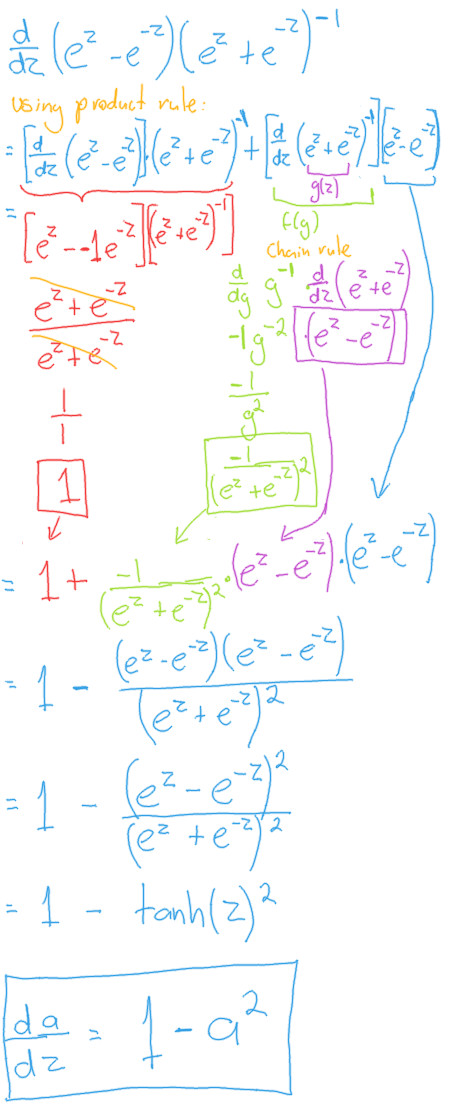
We can see that we end up with the same derivative formula.
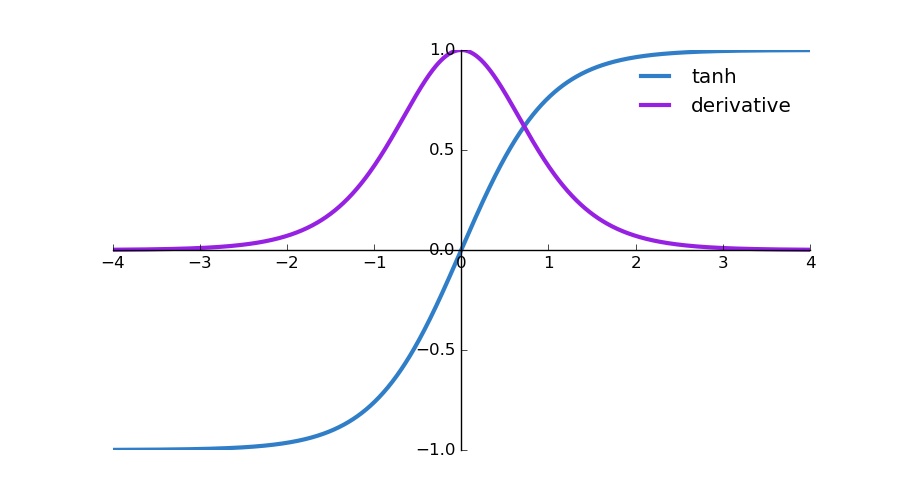
What the derivative looks like
We can create a plot that shows the relationship between the tanh function and its derivative as follows:
import matplotlib.pyplot as plt
import numpy as np

def tanh(z):
    ez = np.exp(z)
    enz = np.exp(-z)
    return (ez - enz)/ (ez + enz)

# Calculate plot points
z = np.arange(-4., 4., 0.01)
a = tanh(z)
dz = 1 - a**2

# Setup centered axes
fig, ax = plt.subplots(figsize=(9, 5))
ax.spines['left'].set_position('center')
ax.spines['bottom'].set_position('center')
ax.spines['right'].set_color('none')
ax.spines['top'].set_color('none')
ax.xaxis.set_ticks_position('bottom')
ax.yaxis.set_ticks_position('left')

# Create and show plot
ax.plot(z,a, color="#307EC7", linewidth=3, label="tanh")
ax.plot(z,dz, color="#9621E2", linewidth=3, label="derivative")
ax.legend(loc="upper right", frameon=False)
fig.show()
Comments
Note you can comment without any login by:
- Typing your comment
- Selecting "sign up with Disqus"
- Then checking "I'd rather post as a guest"